I wanted to make some charts showing linear regressions, but they needed to be images (so libraries like d3.js were out). My first inclination was to use Google’s Image Charts API, but it has been deprecated. I looked around and couldn’t find anything like it.
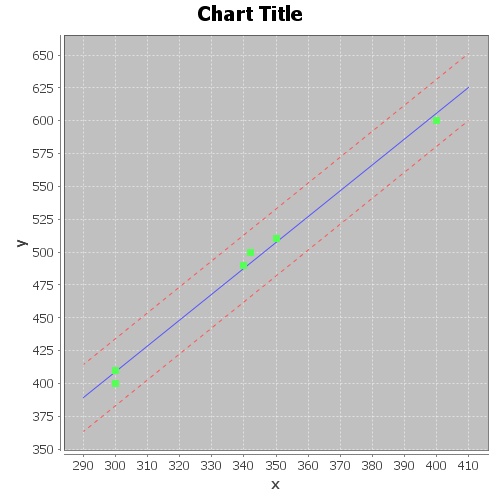
So, it looked like I’d need to code something up. Some searching around turned up some great open source projects. Using JFreeChart and Apache Commons Math, and some blog posts (this one about regression, this one about drawing dashed lines) and a post on StackOverflow about scatter plot basics, I was able to put together the above regression line chart in about half a day.
